How Targeted Sampling Brings an Equity Lens to Analyzing the Curriculum Landscape
Discover how targeted sampling enhances equity in analyzing the curriculum landscape. Learn how focusing on specific districts, such as those serving historically underserved communities, provides a clearer understanding of access to high-quality curriculum. Explore insights from our recent report on California math curriculum and delve into our broader Impact Core data collection approach.


The Center for Education Market Dynamics • February 20, 2024
With over 18,000 school districts across the country, analyzing curriculum selection by district can be a daunting task. Here at the Center for Education Market Dynamics (CEMD), we let our mission to improve outcomes for the nation’s most underserved students guide our strategy for where and what data to collect.
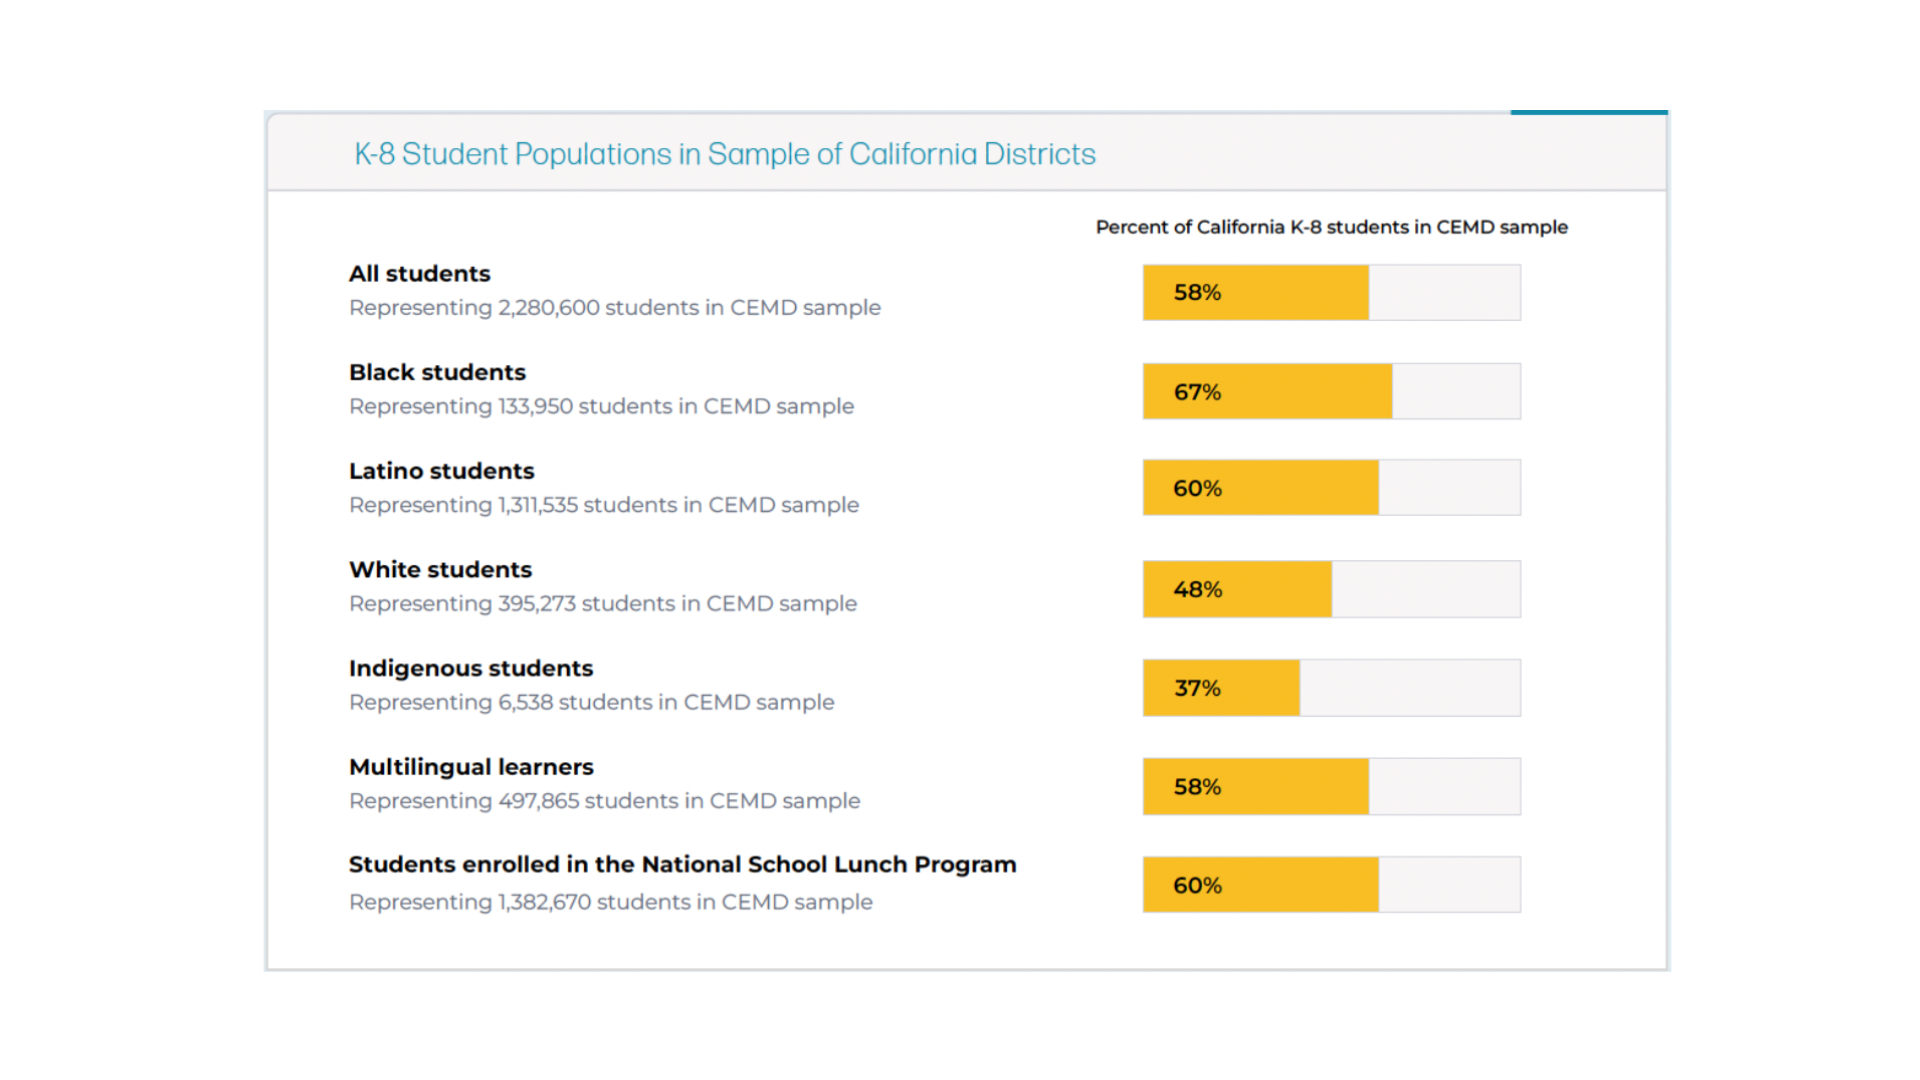
In our recent report on the California math curriculum landscape, for example, our researchers looked at 139 districts that account for only 8% of all public school districts in the state, but encompass the majority (58%) of students. In addition, as shown in the figure below, this data sample intentionally over-represents urban districts that serve higher proportions of Black, Latino, and multilingual learners (MLLs), as well as students experiencing poverty.
This focused sampling approach in California is grounded in our organization’s “why.” It has allowed us to zoom into the curricular experiences of historically underserved students and better understand what access to high-quality curriculum actually looks like. It also reflects our larger data collection strategy of focusing on a subset of 934 districts we call the Impact Core, not only helping us gain a clearer picture of curriculum choices in districts that serve our priority students, but also of the education marketplace as a whole.
Ready to learn more? Be sure to check out CEMD’s latest reports, blogs, and resources.

