
 BACK TO RESOURCES
Frequently Asked Questions
Learn more about CEMD’s work as a data and research hub for K–12 curriculum and instruction, including our approach to data and artifact collection, how we build and maintain our national curriculum selection database, and how we help organizations make evidence-informed decisions to support student success.

General
Who is CEMD?
The Center for Education Market Dynamics (CEMD) is a central hub for data and information about K–12 curriculum and instruction. Anchored by the field’s most comprehensive, standardized dataset on K–12 curriculum adoption, CEMD conducts research and analysis across the broader instructional landscape. By sharing insights for the public good and offering organizations across sectors of the market tools and services that support strategic decision-making and mission impact, CEMD works to strengthen curriculum and instruction to improve outcomes for all students.
What data does CEMD collect?
Annually, CEMD collects:
- District curriculum selection data in all four core subjects: math, ELA, science, and social studies
- Supplemental curriculum selection data, including resources used to support, reinforce, or expand on the core program
- Assessment solution selection data for math and ELA
- State-adopted instructional materials lists
- Key district and state demographic data
As we explore additional questions related to high-quality curriculum and instruction, CEMD has built collections of artifacts, including procurement documents, state and district policies, and district planning and reporting documents that are able to be analyzed alongside our core dataset.
Why does CEMD collect this data?
At the systems level, improving student achievement outcomes requires better insight into how decisions about teaching and learning are actually made: which instructional materials are being selected, how and what types of professional learning are being procured, and how policy shapes these decisions. Too often, organizations working to support districts and students are operating without that picture. CEMD believes that clear and accessible market intelligence, shaped by the dynamics of the market, can build the evidence base for the wider field to ask and answer big questions about the combinations of services, materials, structures, and contexts that lead to student achievement.
Is this data publicly available?
View CEMD’s Market Explorer to gain a closer look at the most frequently chosen curriculum for elementary and middle school by districts across the country.
School districts can also request access to more detailed CEMD data in order to support their own curriculum selection journey. For more information, contact us at [email protected].
CEMD also develops a number of publicly available insights and market reports in order for greater information about the dynamics within the curriculum market to be readily available.
Is my school district included in this data?
CEMD currently collects curriculum insights from roughly 5,000 districts in the United States (US), representing ~76% of all students. To learn if your district is included in the analysis or to provide insights on your district’s curriculum choices, contact us at [email protected].
Can my organization access CEMD data or insights?
CEMD engages with a number of providers of materials and services, as well as researchers, consultants, and philanthropies across the K-12 education space. Please reach out to [email protected] to share more about what you’re hoping to learn and hear how CEMD can support your organization.
Data & Insights
How does CEMD collect data on district curriculum selections?
CEMD uses several data collection methods to gather information about district selections for core curriculum. These include manual research of public websites, direct communication with district offices, and examination of other publicly available sources. Each data point is then coded using CEMD’s customized data framework, which standardizes information across districts so selections can be compared and analyzed consistently nationwide.
How often does CEMD collect data on district curriculum choices?
CEMD collects district curriculum selection by academic year, refreshing the entire data collection on an annual basis.
Are districts required to report curriculum selection information?
Most states do not have policies requiring districts to publicly report their curriculum choices, giving districts wide latitude over whether and how they publicize this information. In practice, districts do often share this information locally in order for families and community members to have insight into the selected instructional materials. CEMD gathers this data for analysis at the state and national level.
Are curriculum selection and usage the same thing?
Not necessarily– CEMD reports the curricula that districts have selected for use, often through a materials adoption process. The extent to which individual classrooms or schools within a district “use” the recommended or selected materials can vary. While a district may adopt a curriculum, teacher buy-in, professional learning and support, and materials quality and connection to community needs can all impact consistent usage.
What is a curriculum “product series”?
A product series includes all editions and copyright years of a given curriculum, which can sometimes hold different quality ratings. Because curricula often have multiple versions, from different copyright years to state-specific products, we find that looking at the prevalence of product series is the most accurate way to understand the true market reach of a curriculum.
Where does CEMD draw quality ratings from?
CEMD uses EdReports ratings for grade-level alignment to categorize curriculum products by quality. EdReports stands as the recognized standard for curriculum quality review in the US, with 42% of school leaders reporting that their district has used EdReports to select, adapt, and implement curriculum.¹
How does CEMD apply quality ratings to curriculum selection data?
CEMD uses the available district information to determine a product series, and where possible, a specific product edition. From there, the related quality rating is applied for that product edition.
- Products without a rating are categorized as “unrated.”
- When a district-stated specific edition is unclear, but all products in that series have received a high-quality, aligned rating from EdReports, CEMD classifies the selection as high-quality. CEMD introduced this update in the 2023–24 data collection to more accurately represent the footprint of HQIM in district selections.
What does “Unspecified” mean in CEMD data?
A curriculum selection is categorized as “Unspecified” when we cannot confirm whether the district’s selection is for a particular version or copyright year within a product series. This typically occurs when a series has multiple editions or when the district provides only the publisher information but not the particulars about the specific curriculum.
What does “Unrated” mean in CEMD data?
“Unrated” refers to curricula that EdReports has not yet reviewed due to recency, market demand, or state-specific editions.
Analysis & Insights
Which districts’ data are used to conduct CEMD’s market analyses?
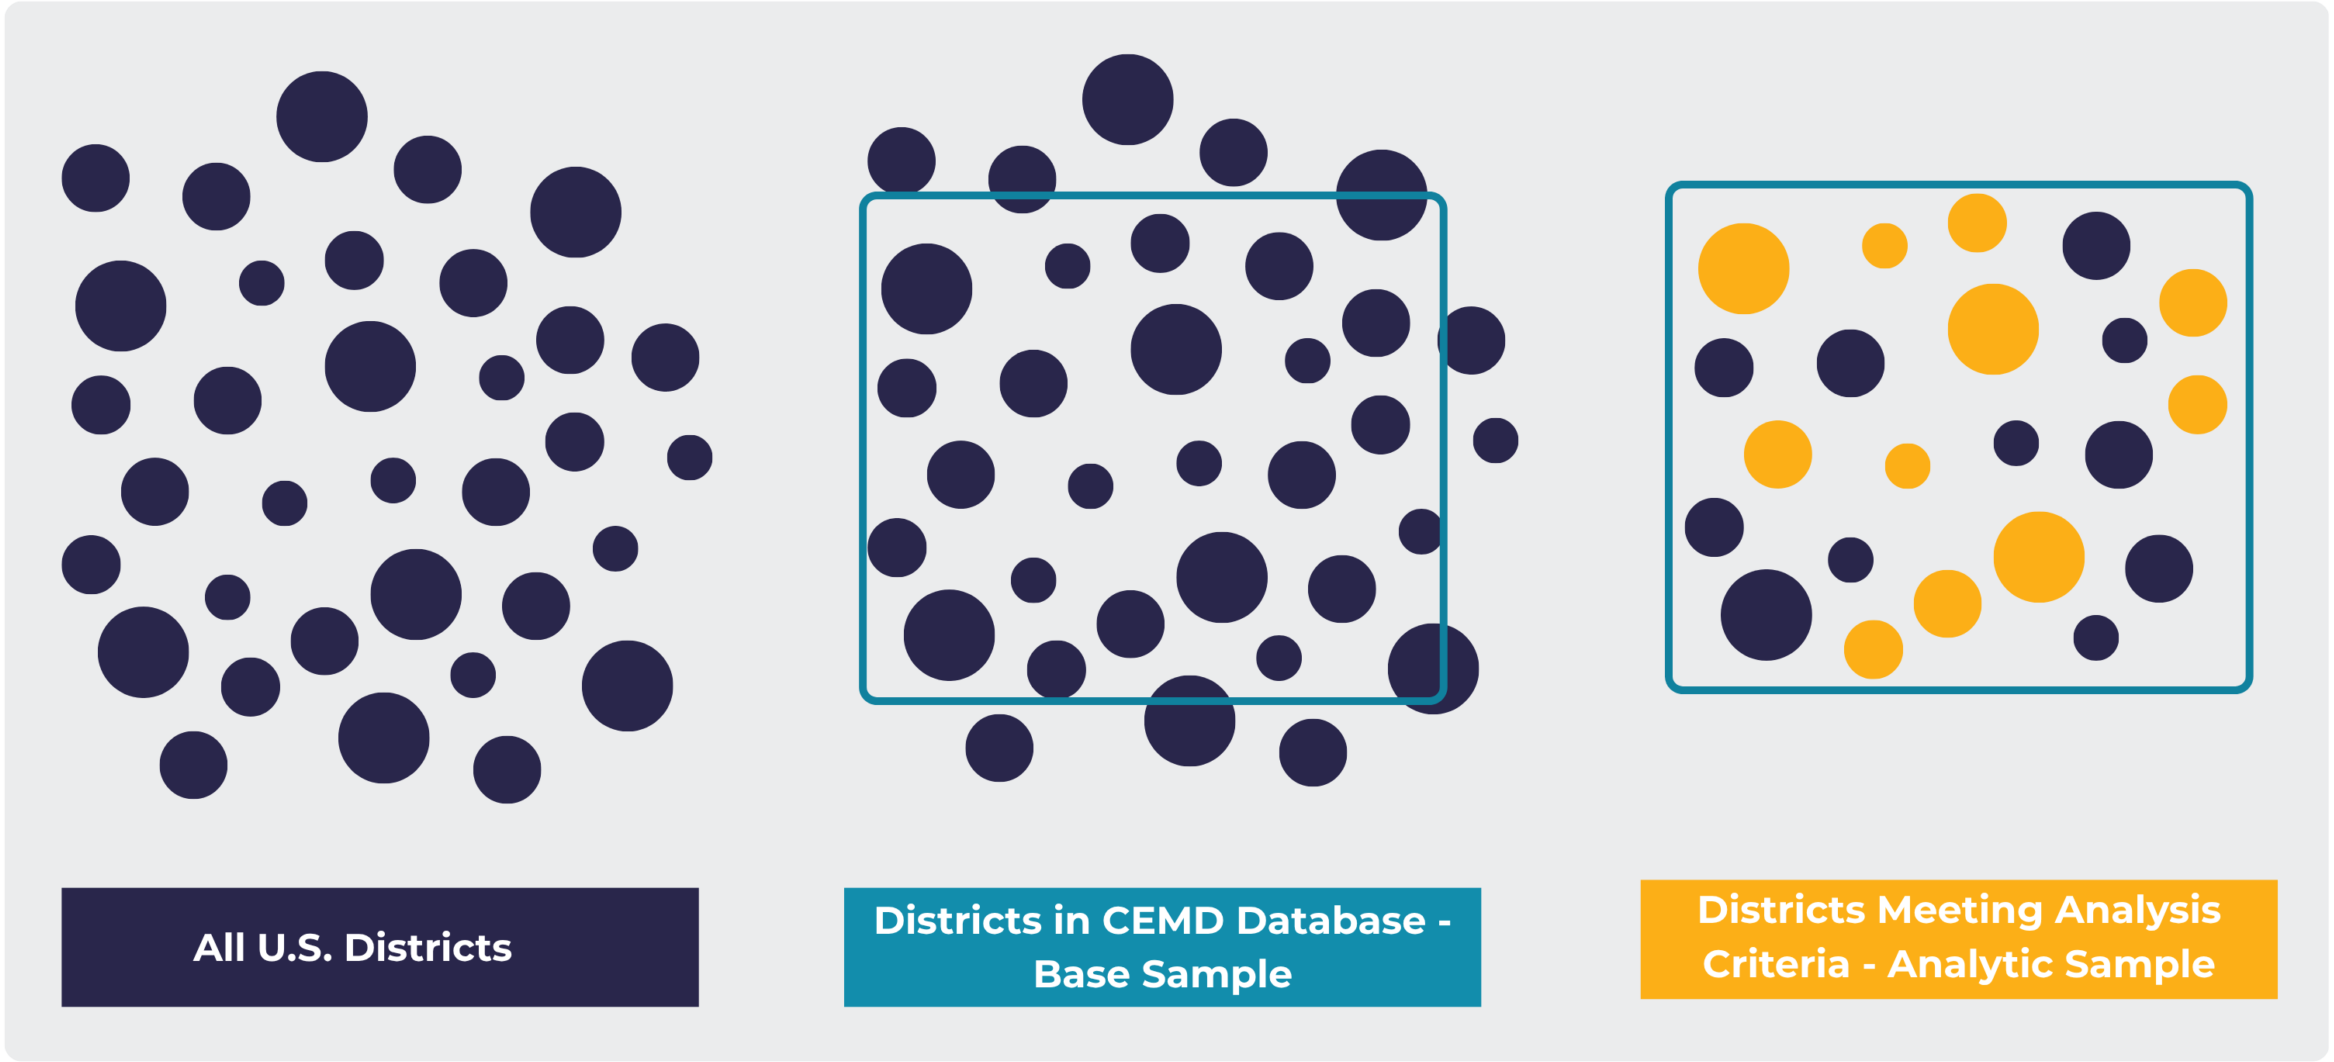
CEMD tracks curriculum data across roughly 5,000 U.S. districts, but each analysis focuses on a defined subset of that full universe. As the graphic shows, we begin with all districts, then narrow to those included in the CEMD database (our base sample), and finally refine further to districts that meet the specific criteria for a given analysis.
For example, an analysis of elementary ELA curriculum in California would first limit the dataset to California districts, then to elementary districts within that group, and finally to those that meet all analytic requirements and have complete data. This final subset—shown as the highlighted sample—represents the districts included in the analysis.
Because each analysis applies its own filtering criteria, the number of districts included (the n-value) will vary across different analyses within a report.
CEMD’s other research and analyses draw on different samples, documented in each publication, and are dependent on data availability and representativeness of the sample.
How is the prevalence of a given curriculum calculated?
The prevalence of a curriculum is based on the number of districts that selected that curriculum (among the set of districts being analyzed) and is expressed as a percentage of all districts with curriculum selection data for the given subject and grade band.
How is year-over-year (YOY) change reflected?
YOY change is calculated in one of two ways—either the prevalence of a curriculum in the dataset as a whole is compared from one year to the next, or the analysis focuses only on districts selecting that particular curriculum in the first year measured. Choice between these two options often comes down to sample size and applicability of analysis.
Why do some percentages in analyses add up to more than 100 percent?
In some cases, districts select multiple instructional materials—for example, a combination of core and supplemental materials, or more than one core or supplemental resource. When districts make multiple selections, those choices are each reflected in the analysis, which can cause the percentages to total more than 100 percent.
Getting Involved
Can I use CEMD research or data in my report, article, or presentation? How should I cite it?
Of course! We believe strong data helps tell compelling stories and anchor informed action. To use CEMD data, please cite appropriately.
To cite a CEMD brief, report, blog, or similar resource, use the following sample citation to guide your own:
The Center for Education Market Dynamics. (2025). California Math: High School Curriculum Trends. https://www.cemd.org/california-math-high-school-curriculum-trends/.
To cite data accessed through Market Explorer, use:
Center for Education Market Dynamics, “Market Explorer,” accessed [date], https://www.cemd.org/market-explorer/.
In what other ways can this data be used?
CEMD’s data and research help organizations across the K–12 education field see where high-quality curriculum and instruction are reaching students and where gaps remain. Funders and nonprofits use it to target their support where it can make the biggest difference. State education agencies have used it to ground leadership conversations in evidence, and curriculum developers have used it to understand how their materials are being adopted and to track progress over time. District leaders also draw on it when navigating curriculum adoption. If you’re working to strengthen teaching and learning, we’d love to explore how CEMD’s data can support your work.
¹ According to the RAND AIRS (2023), 52% of school leaders report having heard of EdReports, and 42% of school leaders report that their district has used EdReports to select, adapt, and implement curriculum.

