K–8 Math Curriculum Quality: The State of District-Led Selection
Students need math curriculum that engages and challenges them. In this report, CEMD paints a picture of the national footprint of high-quality math curriculum, with a focus on historically underserved students.
Get the full report
The Center for Education Market Dynamics • August 15, 2023
This report has been updated from a prior version as of September 14, 2023.
High-quality math curriculum has research-based best practices for deepening student math learning baked into it.
Over the last decade, the sector has come a long way in terms of articulating what this looks like – via new research and quality arbiters like EdReports, for example – and such curricula establishing a steadier foothold in the market.
It’s long been unclear the extent to which students and teachers have access to this crucial instructional resource. Observational studies generally suggest that low curriculum quality persists in many math classrooms, especially those with high concentrations of historically underserved students. Very little exists in the way of aggregated, public information about district and school curriculum selection.
CEMD has set out to better understand this landscape, and to map the national footprint of high-quality math curriculum.

In Figure 1, the left image shows all U.S. school districts, in orange; the right image shows Impact Core districts, overlaid in blue. The size of the circles represents student enrollment. As the maps illustrate, the Impact Core sample is concentrated in areas of high student enrollment.
We focus on a subset of 934 districts we call the “Impact Core,” which represents over 52% of all students nationwide. This also captures an outsized number of historically underserved students because we intentionally oversampled large, urban districts. We gathered data on math curriculum selection for these districts and analyzed it through the lens of quality.
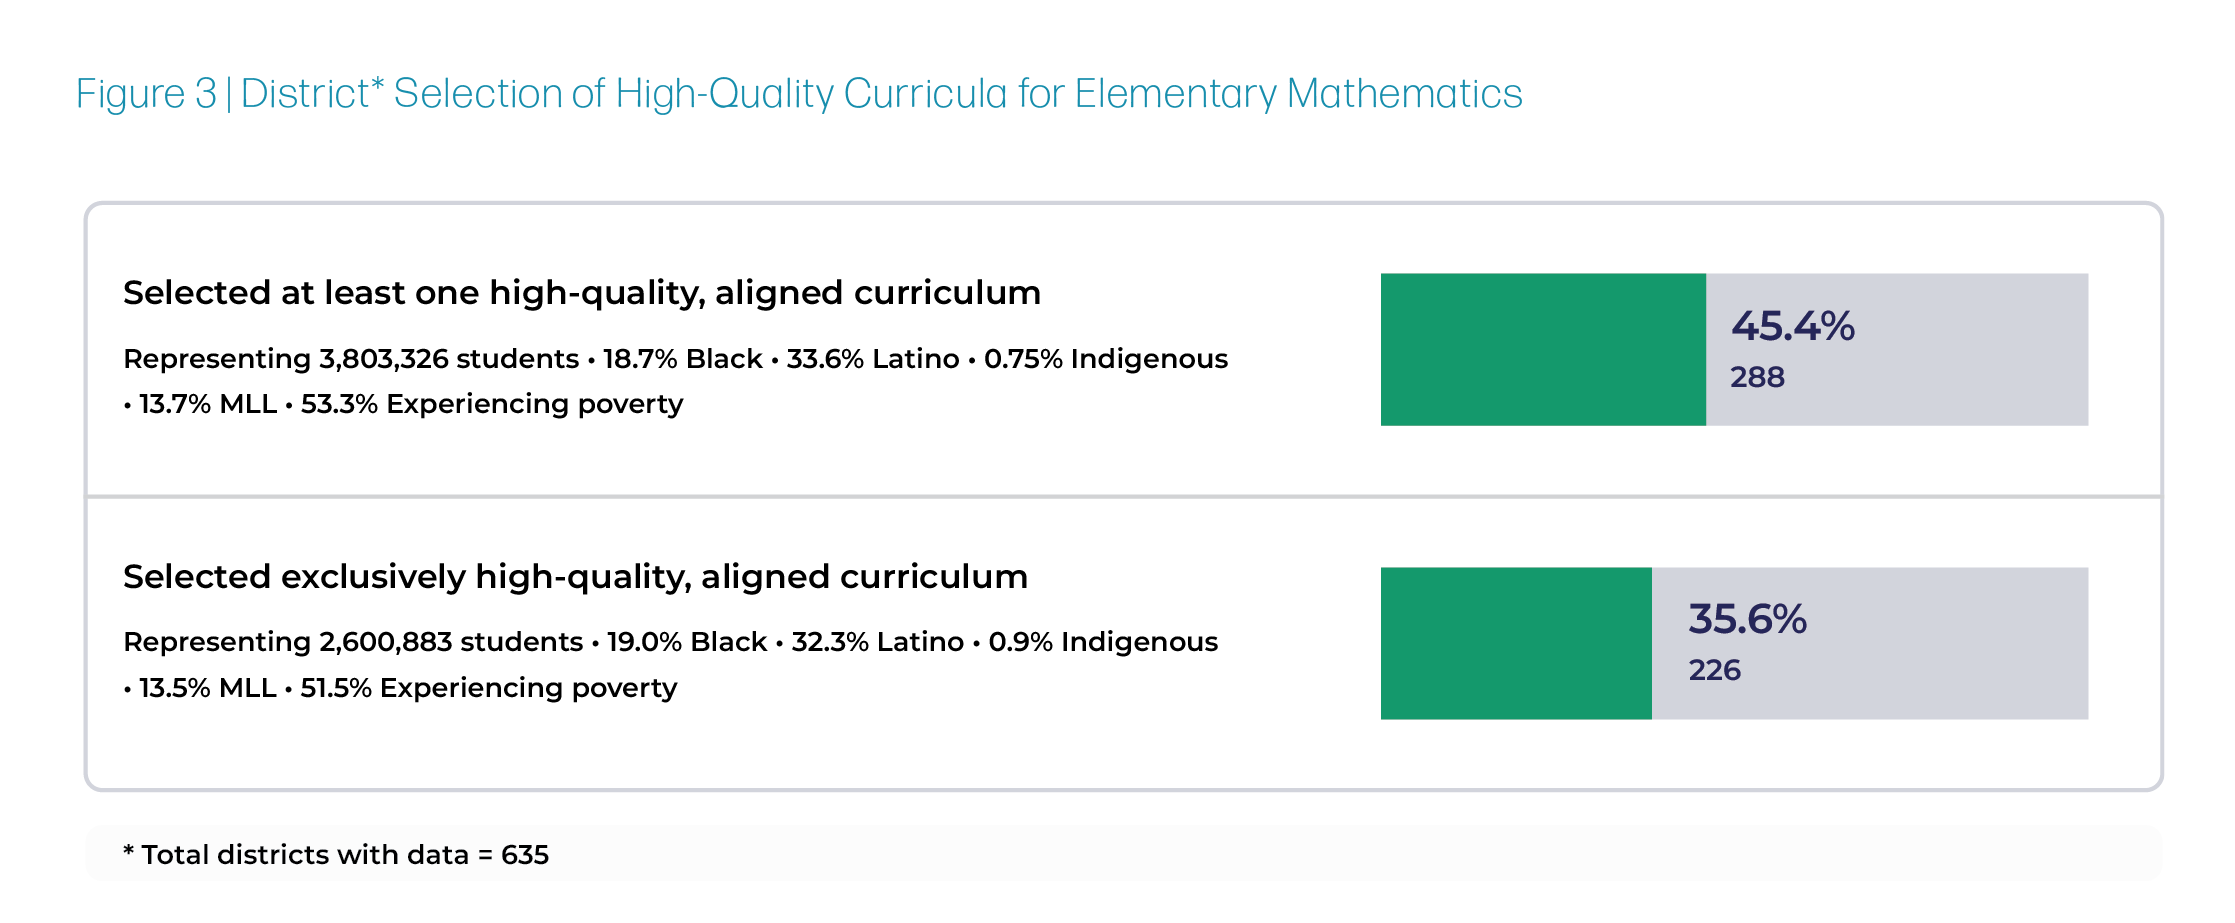
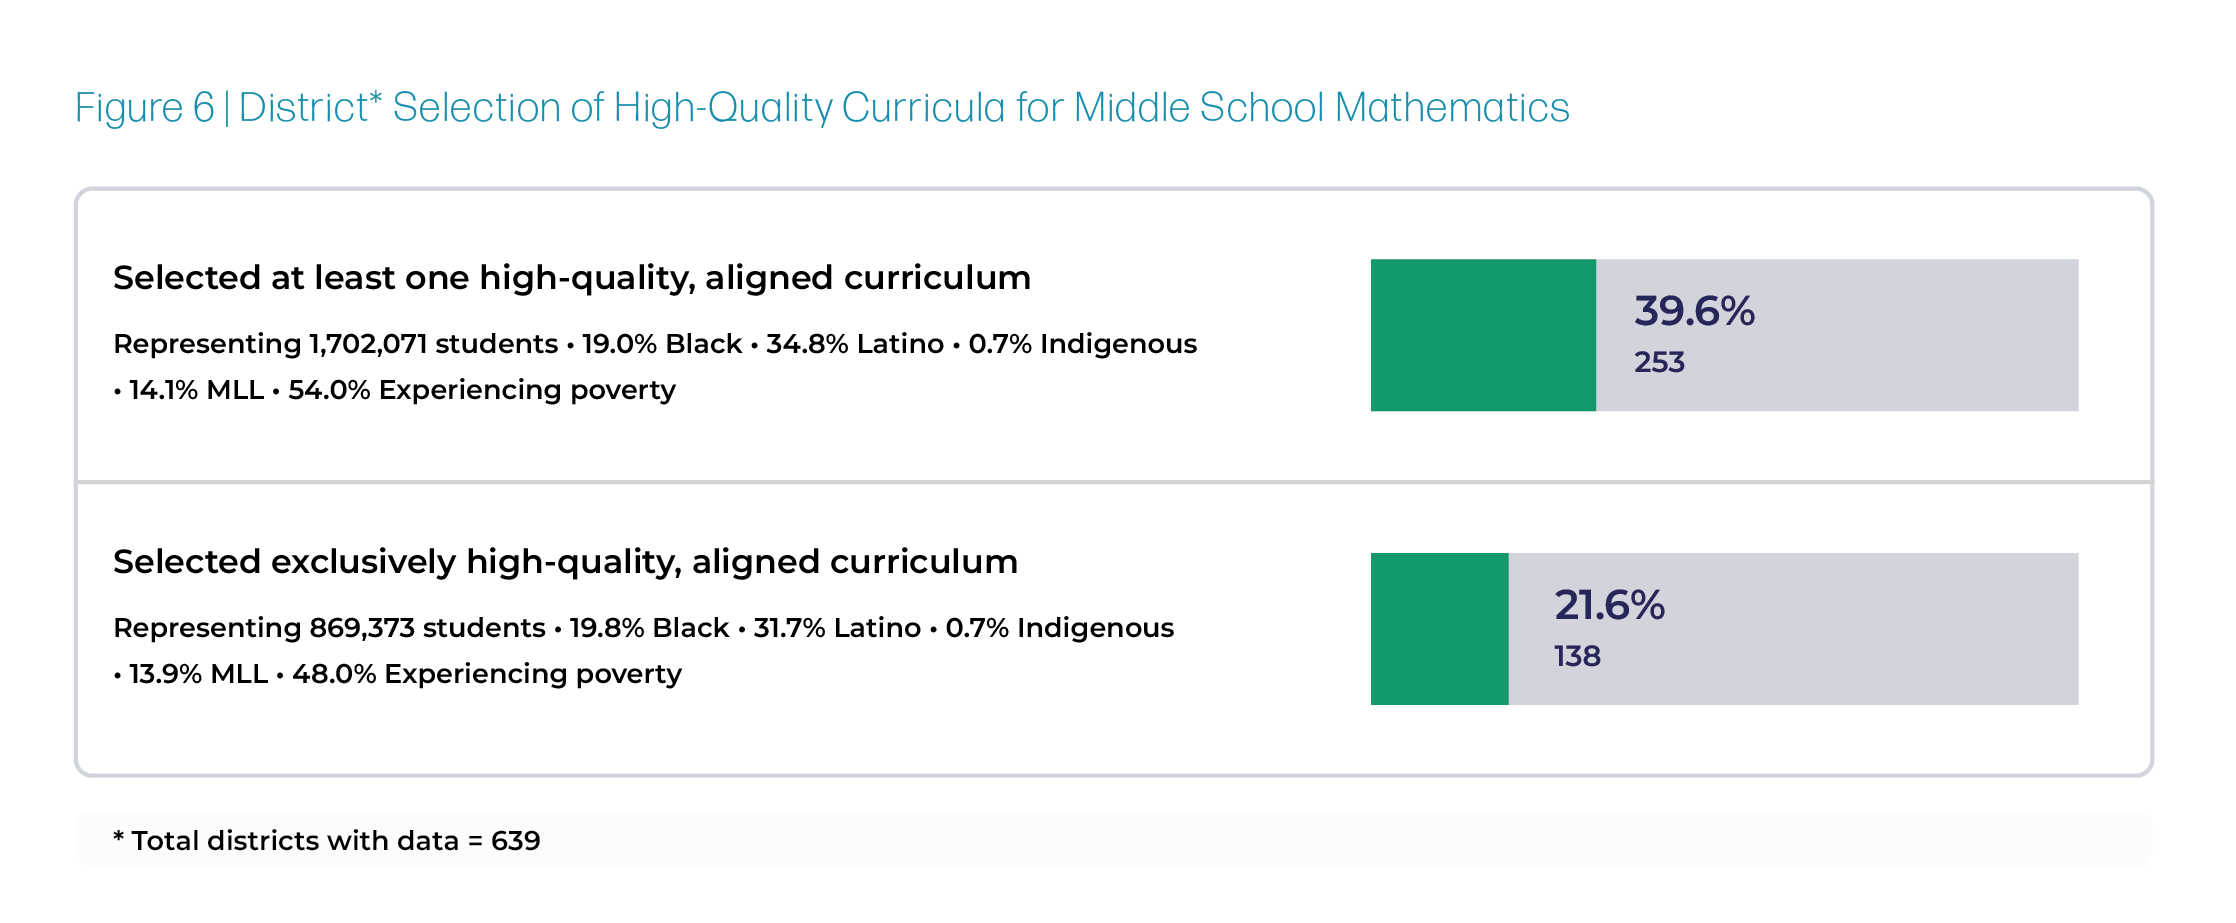
We found that about 36% of these districts have selected exclusively high-quality math curriculum for elementary school, and about 22% for middle school. Many other districts in the sample have selected a curriculum that is not fully aligned with quality criteria (per EdReports), or is state-specific and of indeterminate quality.
While high-quality math curriculum still represents a minority of district-selected curricula overall, we believe the data is suggestive of sector-level progress towards quality. We also see clear signals in the market that quality will continue to expand its footprint in coming years.
Our next report, K–8 Math Curriculum Products & Publishers: The State of District-Led Selection, digs deeper into this market, examining the specific publishers and products that constitute it, as well as the important shifts that are in progress. Join us for this finer-grained look at the curricula that shape our students’ daily learning experiences in math.
Want to read the full report?
Download the PDF
